Docs Retention
Turn a retention graph into something you can act on
A curve tells you people left at 2:41. It does not tell you what was happening at 2:41, which is the only part you can act on. This lines the curve up against your beats.
The problem it solves
Everyone says to study your retention graph. Nobody says how to turn a slope into a decision. You see the dip, rewatch the section, and come away feeling it was a bit slow.
What it needs first
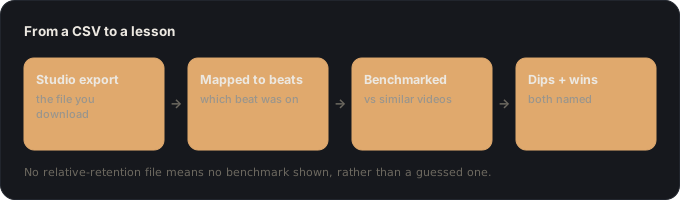
- A published video, and its retention export from YouTube Studio. The lens reads the file you download rather than connecting to your account.
- The spine for that video, so drops can be attributed to the beat that was on screen when viewers left.
How it works
- 1 The published cut is read backYour final video is segmented into the beats that actually aired, timecoded, which is often not the list you planned.
- 2 The curve is matched to the beatsEach drop is attributed to the moment it happened in, so the output names a beat rather than a timestamp.
- 3 Each drop is benchmarkedYouTube also exports how this video did against typical videos of a similar length. That comparison decides how much a dip matters: every video loses viewers in the first thirty seconds, and only some lose them faster than the baseline.
- 4 You get lessons, not observationsFindings come out as changes you could make next time, phrased as instructions rather than diagnoses.
What you get back
- Drops mapped to beats
- Each dip attributed to the beat playing at that moment, which turns 'it dips at 2:40' into 'the setup beat runs long'.
- A benchmark per beat
- Where YouTube's relative-retention export is present, each beat is compared against typical videos of similar length. A dip that beat the baseline is not the problem it looks like.
- Wins as well as dips
- The beats that held are named too, so the lesson is repeatable rather than only corrective.
- A cross-video aggregate
- Once several videos are analysed, patterns by beat kind emerge: which of your beats habitually lose people.
What it will not do
- It needs the export. Without the relative-retention file the analysis is absolute-only, and the benchmark section is omitted rather than guessed.
- Correlation, not causation. It can tell you where people left; the reason is a judgement you make with the transcript in front of you.
- Small-sample caution is deliberate. A beat with too few data points gets no benchmark rather than a confident wrong one.
What it buys you
- A dip becomes "the backstory ran before the claim landed" instead of "retention fell at 1:10".
- A steep drop that is normal for the format stops looking like an emergency, and a shallow one that is not gets taken seriously.
- Comparing aired beats against planned ones shows where the edit drifted and what it cost.
- Lessons accumulate across videos instead of being re-derived each time.
Under the hood
The retention pass segments the aired video independently of the plan, then reconciles the two. That independence is what makes the agreement meaningful: on the sleeper-bus case study, this pass and the pre-publish verdict flagged the same three problems without ever seeing each other's output. The benchmark is deliberately conservative: a beat with too few samples to judge, or a gap small enough to be curve noise, is reported as nothing at all rather than as "average", because a confident number drawn from noise is worse than silence.
On a real video
 My 20-hour Vietnam Sleeper Bus Mistake Read the case study →
 Questions
Where does the retention data come from?
You export it from YouTube Studio and bring it in. The app never asks for channel access.
What is it benchmarked against?
YouTube's own relative-retention export, which compares your video against typical videos of a similar length. If you do not include that file the analysis still runs; it simply says nothing about the baseline rather than guessing one.
Do I need the original project?
It is far more useful with one, since the value is comparing aired against planned. It will still segment and read a video without a plan behind it.
How many videos before this is useful?
One is enough to get lessons for the next. The compounding starts when you see the same lesson twice.
Retention is one lens of Vanpelt Studio.