Growth & analytics · Lesson 1
The only metrics that matter
Views and subscribers are scoreboards; CTR, retention, and returning viewers are steering wheels. The four metrics worth a weekly look, and the vanity ones worth ignoring.
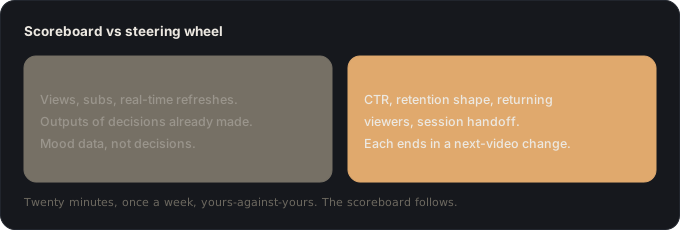
YouTube Analytics ships dozens of metrics, and the two everyone stares at (views and subscribers) are the two you can do the least about. They’re scoreboards: outputs of decisions you already made, refreshed hourly by the least useful version of your attention. Growth reading is the opposite discipline: ignore the score, watch the steering wheel, the handful of input metrics that map one-to-one onto decisions you can actually make on the next video.
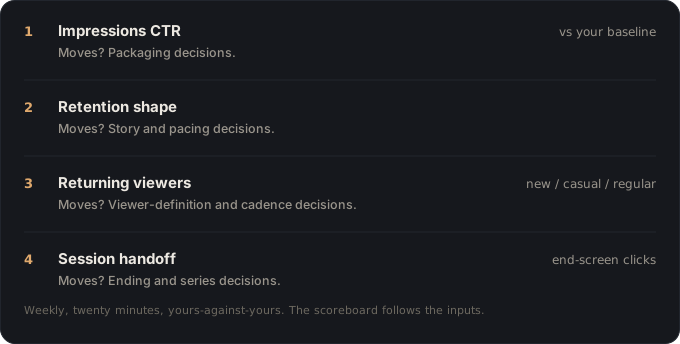
Four of them cover a solo channel.
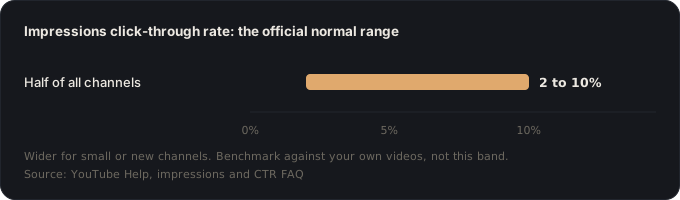
Impressions CTR: did the packaging pull? Read against your own baseline per traffic source, never against the folklore benchmarks: YouTube’s own documentation puts half of all videos between 2% and 10%, a range so wide that only your history means anything. CTR moves → packaging decisions.
Average view duration + the retention curve: did the video keep its promise? You know how to read the shape: the cliff, the slope, the dips, each one naming a structural decision for next time. Retention moves → story and pacing decisions.
Returning viewers: is the channel building a relationship or renting traffic? The new/casual/regular split is the platform’s own model of loyalty, and a channel whose regulars grow is compounding even while raw views wobble. Returning moves → viewer-definition and cadence decisions.
End-screen clicks / session handoff: does one view become two? The session tools report whether your endings are opening next questions anyone wants answered. Handoff moves → ending and series decisions.
What the four deliberately exclude
Subscribers: a lagging echo of satisfied viewing; nobody subscribes because they were asked, they subscribe because the last two videos landed. Fix the four inputs and this follows. Total watch time as a target. It’s the outcome of retention × reach, not a lever; chasing it directly produces padded videos, which the retention curve then punishes. Real-time views: a mood ring, not an instrument. Likes and comments: read the comments for content (promise mismatches, requests, next-video seeds), not the counts.
And the meta-rule that keeps analytics honest: every number is yours-against-yours. Niche, video length, and audience age make cross-channel comparison noise: the tutorial channel’s 4% CTR and the vlog’s 9% can be equally healthy. The only clean experiment on YouTube is your last video against your next one.
The weekly reading
The cadence matters as much as the metrics: once a week, twenty minutes, four numbers, each ending in a sentence about the next video. “CTR dipped on browse → next thumbnail leads with the face.” “Regulars flat for a month → cadence contract needs attention.” Daily analytics immersion produces launch-window anxiety and zero additional information; the weekly read produces decisions, and decisions are the only thing analytics is for. (The deep version of this reading, run per-video, is the post-mortem: next lesson.)
The metrics check
- Four inputs read weekly: CTR, retention shape, returning viewers, session handoff.
- Each reading ends in one next-video sentence, or it didn’t count.
- Everything compared yours-against-yours; zero cross-channel benchmarking.
- Scoreboard metrics (views, subs, real-time) checked for morale only, rationed accordingly.
- Comments read for content weekly; counts ignored.
🎬 Video script
- Open on the analytics home screen with everything blurred except four numbers: “This is the whole dashboard. The rest is weather.”
- Walk each input with its decision on screen: metric moves → this changes on the next video.
- Show the vanity trap: two identical-looking view counts, one healthy (regulars growing), one hollow.
- Run a real twenty-minute weekly reading, writing the four sentences live.
- Close: “Steer by inputs. The scoreboard catches up on its own.”
Sources
- YouTube Help, Impressions & click-through-rate FAQs: the 2-10% spread, and why baselines beat benchmarks.
- YouTube Help, Understand your YouTube audience and new, casual, & regular viewers: the loyalty metrics behind returning viewers.
Key takeaways
- Steer by inputs (CTR, retention, returning viewers, session handoff), the scoreboard follows.
- Every metric is read against your own baseline, never against other channels.
- One weekly look at four numbers beats daily immersion in twenty.